Radial FLASH#
Qualitative imaging with a golden radial FLASH (spoiled gradient echo) sequence.
Imports#
import importlib

if not importlib.util.find_spec('mrseq'):
    %pip install mrseq[examples]
import tempfile
from pathlib import Path

import matplotlib.pyplot as plt
import MRzeroCore as mr0
import numpy as np
from einops import rearrange
from mrpro.algorithms.reconstruction import DirectReconstruction
from mrpro.data import KData
from mrpro.data.traj_calculators import KTrajectoryIsmrmrd
from mrpro.operators.models import SpoiledGRE
from raw2ismrmrd.utils import combine_ismrmrd_files

from mrseq.sequences.radial_flash import main as create_seq
from mrseq.utils import sys_defaults
/opt/hostedtoolcache/Python/3.12.15/x64/lib/python3.12/site-packages/tqdm/auto.py:21: TqdmWarning: IProgress not found. Please update jupyter and ipywidgets. See https://ipywidgets.readthedocs.io/en/stable/user_install.html
  from .autonotebook import tqdm as notebook_tqdm
Settings#
We are going to use a numerical phantom with a matrix size of 128 x 128. To ensure we really acquire all radial lines in the steady state, we use a large number of dummy excitations before the actual image acquisition.
image_matrix_size = [128, 128]
flip_angle_degree = 12
n_dummy_excitations = 200

tmp = tempfile.TemporaryDirectory()
fname_mrd = Path(tmp.name) / 'radial_flash.mrd'
Create the digital phantom#
We use the standard Brainweb phantom from MRzero, but we choose the B1-field to be constant everywhere.
phantom = mr0.util.load_phantom(image_matrix_size)
phantom.B1[:] = 1.0
Create the radial FLASH sequence#
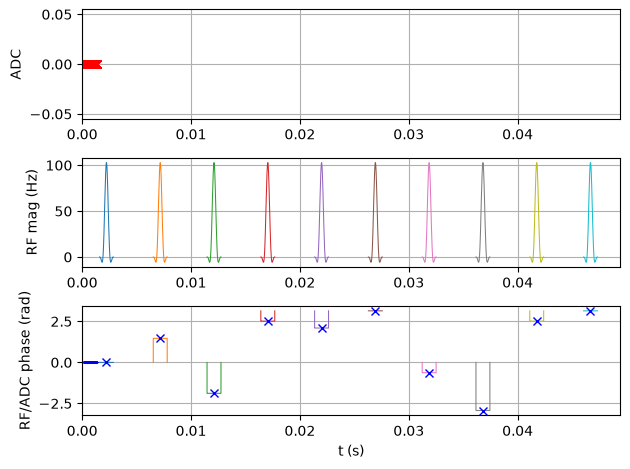
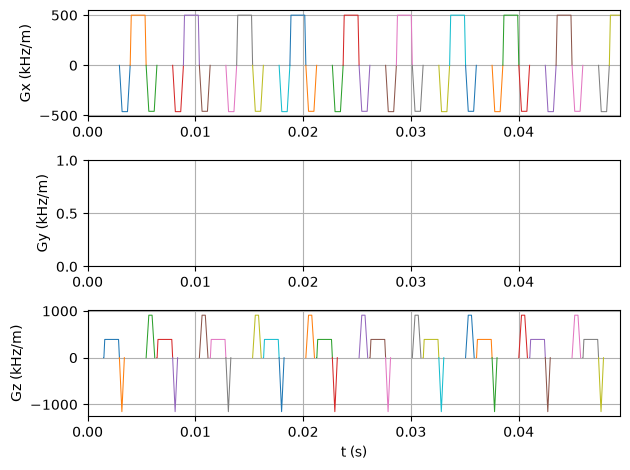
To create the radial FLASH sequence, we use the previously imported radial_flash script.
sequence, fname_seq = create_seq(
    system=sys_defaults,
    test_report=False,
    timing_check=False,
    n_dummy_excitations=n_dummy_excitations,
    rf_flip_angle=flip_angle_degree,
    fov_xy=float(phantom.size.numpy()[0]),
    n_readout=image_matrix_size[0],
    n_spokes=int(image_matrix_size[1] * np.pi / 2),
)
Current echo time = 2.462 ms
Current repetition time = 4.940 ms
Saving sequence file 'radial_flash_200fov_128nx_201na_1ns.seq' into folder '/home/runner/work/mrseq/mrseq/examples/output'.
Simulate the sequence#
Now, we pass the sequence and the phantom to the MRzero simulation and save the simulated signal as an (ISMR)MRD file.
mr0_sequence = mr0.Sequence.import_file(str(fname_seq.with_suffix('.seq')))
signal, ktraj_adc = mr0.util.simulate(mr0_sequence, phantom, accuracy=1e-1)
mr0.sig_to_mrd(fname_mrd, signal, sequence)
combine_ismrmrd_files(fname_mrd, Path(f'{fname_seq}_header.h5'))
>>>> Rust - compute_graph(...) >>>
Converting Python -> Rust: 0.002511582 s
Compute Graph
Computing Graph: 4.8895683 s
Analyze Graph
Analyzing Graph: 0.12194185 s
Converting Rust -> Python: 1.1099638 s
<<<< Rust <<<<
<ismrmrd.hdf5.Dataset at 0x7efca1d4ac90>
Reconstruct the image#
We use MRpro for the image reconstruction.
kdata = KData.from_file(str(fname_mrd).replace('.mrd', '_with_traj.mrd'), trajectory=KTrajectoryIsmrmrd())
recon = DirectReconstruction(kdata, csm=None)
idata = recon(kdata)
/opt/hostedtoolcache/Python/3.12.15/x64/lib/python3.12/site-packages/mrpro/data/KData.py:166: UserWarning: No vendor information found. Assuming Siemens time stamp format.
  warnings.warn('No vendor information found. Assuming Siemens time stamp format.', stacklevel=1)
Compare to theoretical model#
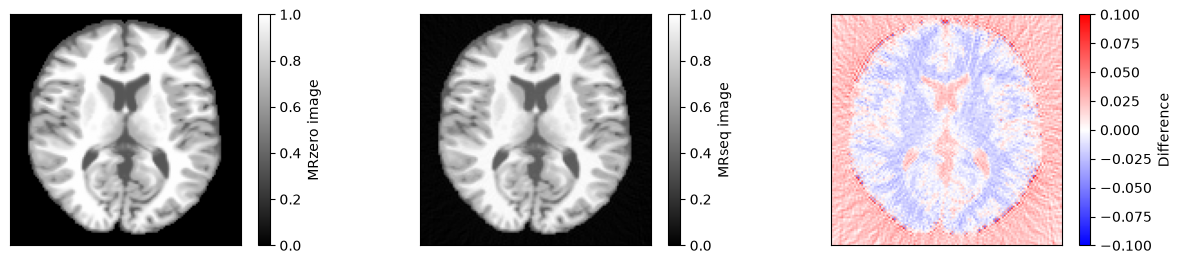
We can now compare the result to a simulation using the idealized signal model for spoiled gradient echo sequences. First, we need to calculate \(T2^*\) using \(1/T2^* = 1/T2 + 1/T2'\).
t2star = 1 / (1 / phantom.T2 + 1 / phantom.T2dash)
model = SpoiledGRE(flip_angle=np.deg2rad(flip_angle_degree), echo_time=kdata.header.te, repetition_time=kdata.header.tr)
idat_model = model(m0=phantom.PD, t1=phantom.T1, t2star=t2star)[0]
idat_model = idat_model.detach().abs().numpy().squeeze()
idat_model /= idat_model.max()
idat_model = np.roll(rearrange(idat_model[::-1, ::-1], 'x y -> y x'), shift=(1, 1), axis=(0, 1))

idat = idata.data.abs().squeeze().numpy()
idat /= idat.max()

fig, ax = plt.subplots(1, 3, figsize=(15, 3))
for cax in ax:
    cax.set_xticks([])
    cax.set_yticks([])

im = ax[0].imshow(idat_model, vmin=0, vmax=1, cmap='gray')
fig.colorbar(im, ax=ax[0], label='MRzero image')

im = ax[1].imshow(idat, vmin=0, vmax=1, cmap='gray')
fig.colorbar(im, ax=ax[1], label='MRseq image')

im = ax[2].imshow(idat - idat_model, cmap='bwr', vmin=-0.1, vmax=0.1)
fig.colorbar(im, ax=ax[2], label='Difference')

relative_error = np.sum(np.abs(idat - idat_model)) / np.sum(np.abs(idat_model))
print(f'Relative error {relative_error}')
assert relative_error < 0.05
Relative error 0.03582616835491626